
[Summary]
- Comparing to the same period of last year (2022), the rainfall amount of this year is significantly lower.
- The ONI Index shows that El Nino is likely inevitable. The Thai Meteorological Department declares that Thailand has been affected by El Nino since June and the effect will prolong until March next year.
- Although the overall picture of Thailand is drought, locally heavy rains are possible.
- The storage levels in major dams of Chao Phraya River in the Northern Regions are in an increasing trend. However, the storage level in Pasak Dam is in a critical level.
- The river levels of Ping, Wang, Yom, Nan slightly increased from last month. The river situations in Sukhothai Province should be closely monitored.
Precipitation
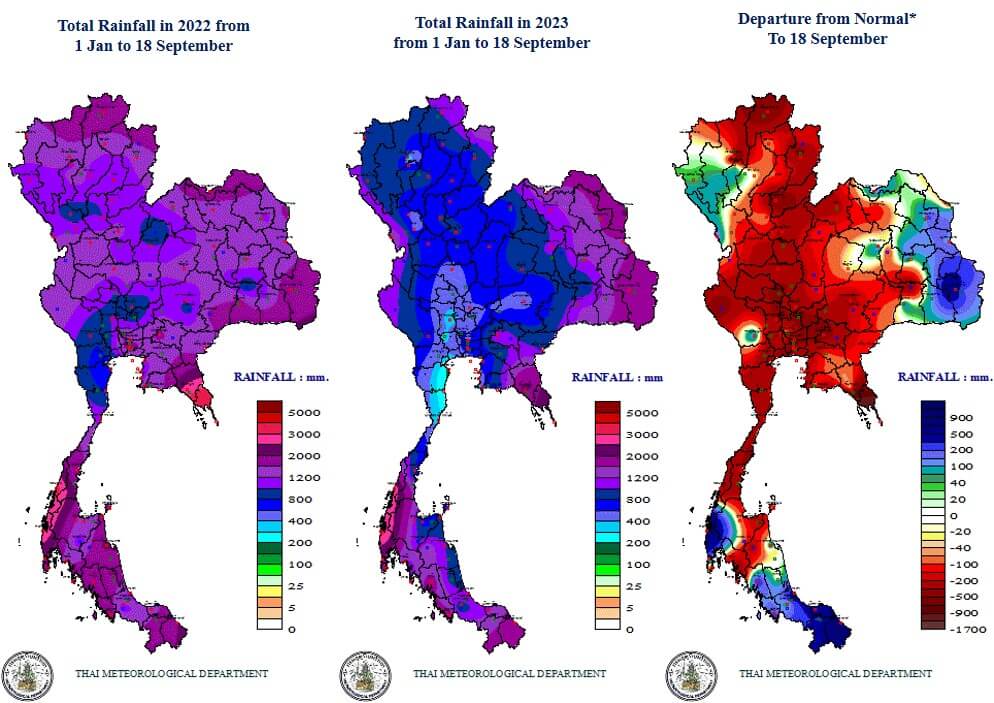
Figure 1: Rainfall situation (Source : Thai Meteorological Department)
Comparing to September last year (2022), the accumulate rainfall amount of this year is substantially lower, especially in the Northern and Central areas as shown in the figures above. The rainfall amount in 2022 (until 18 September) is in the range between 600 to 3000 mm, while it is only 200 to 3000 mm in 2023 (until 18 September). If comparing to the normal rainfall value, the accumulated rainfall amount of this year is -200 mm on average.
* Normal value is the average rainfall amount within the period of 30 years (1981-2010)
Forecast
October is the transition month from rainy season to winter, and unstable weather is expected. Total rainfall in Thailand is expected to be about 10 percent below normal, and average temperatures* will be higher, however, the southwest monsoon may cause locally heavy rainfall.
* Average temperature is an average temperature throughout the year within a period of 30 years (1981-2010).
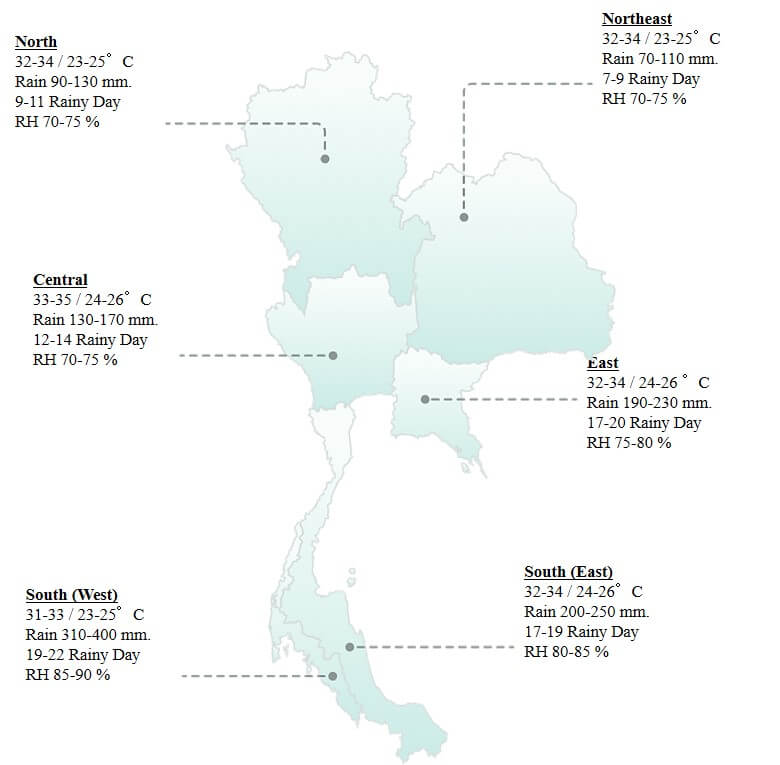
Figure 2 : Forecast in October (Source : Thai Meteorological Department)
El/Nino Update
The El Nino is a phenomenon in which sea surface temperatures rise above normal in the equatorial Pacific Ocean from near the date line to the coast of South America and remain so for about one year, significantly affecting the global climate. In Southeast Asia, rainfall is expected to decrease and droughts may occur. According to ONI index shown in the below figure, the index still shows an increasing trend of the sea surface temperature (SST) which is at least higher than 0.5 from April to June. If the SSTs of July and August came out and continue the trend, El Nino would likely to be confirmed. In addition, if comparing the SSTs of this year to 2015 which is one of the driest years of Thailand, the values still seem to be lower. According to the Thai Meteorological Department, Thailand will face El Nino from June until at least March 2024 which will lead to a drought situation.
Looking back to 2015, a severe drought caused an extensive effect to Thailand which includes:
- The lowest recorded yearly rainfall amount since 1981
- The water storage levels in all large-size dams were in critically low level.
- Increase in wildfire events which leads to an air pollution problem
- The water levels in some main rivers are depleted.
- Crop production decreased significantly and prices of many groceries increased.
- The irrigation systems capacity in Eastern Bangkok and Pathumthani Province were scarce. Moreover, the industrial water supply in Lampoon Province was disturbed.
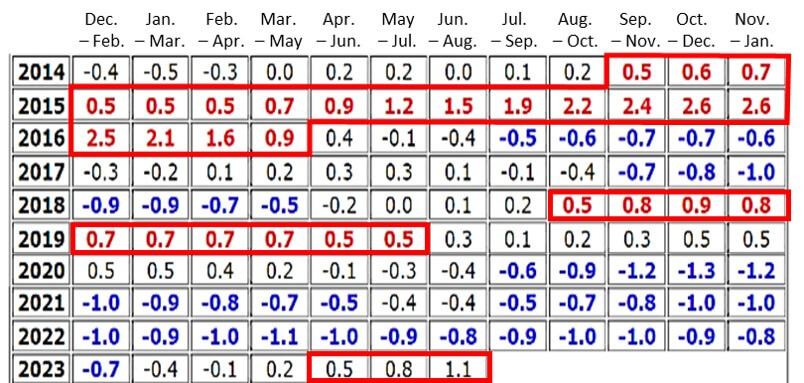
Table 1 : ONI index (Source : NOAA)
IEAT (Industrial Estate Authority of Thailand) has predicted that this year’s El Nino situation would not be severe. FTI (The Federation of Thai Industries) stated that the private sector is closely monitoring the water situation and proposed the government to be prepared for a long-haul drought situation that might last for 2-3 years. If the drought situation was not appropriately managed, the occupancies that would be affected are food and beverages, paper, petrochemical, textile, metals, power plant, and electronics. During the 2015 drought, many factories took measures such as reusing wastewater and purchasing industrial water from private companies. Important thing for companies is to watch the weather. We recommend that you listen to the water level of the location where you want to water intake the industrial water to the industrial park. It is also important to know the support measures of the government and industrial relations institutions do.
Dam Storage Level (Sirikit Dam, Bhumibol Dam)
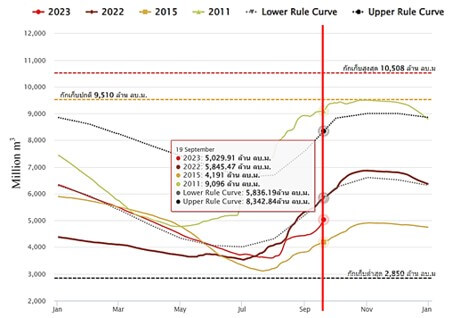
Figure 3 : Storage level Sirikit Dam (52%, 18 September)
(Source : National Hydroinformatics Data Center)
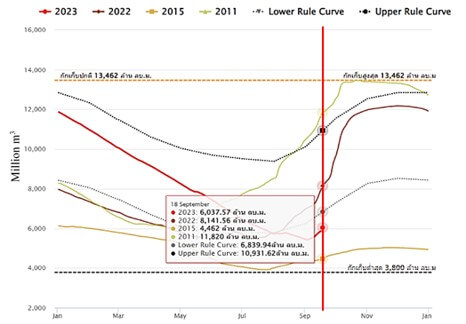
Figure 4 : Storage level Bhumibil Dam (45%, 18 September)
(Source : National Hydroinformatics Data Center)
The storage level of on Bhumibil Dam seems to be turning to an increasing trend. Likewise, Sirikit Dam is also in an increasing trend (from 38 to 52 percent comparing to last month). The storage levels in both dams are still higher than 2015.
Dam Storage Level (Pasak Dam, Kwaenoi Dam)
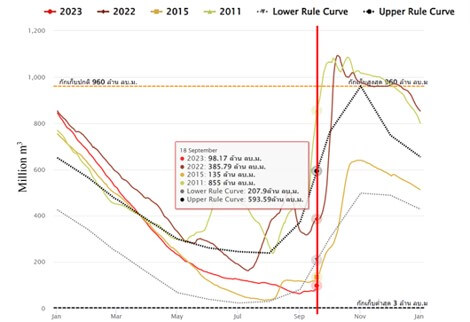
Figure 5 : Storage level Pasak Dam (10%, 18 September)
(Source : National Hydroinformatics Data Center)
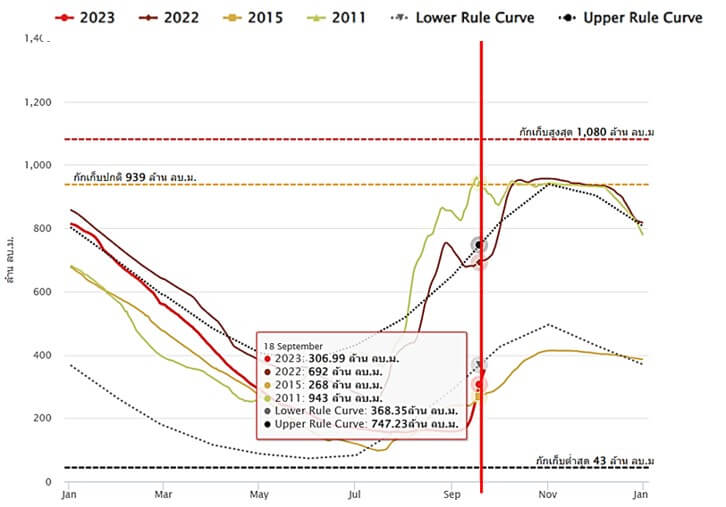
Figure 6 : Storage level Kwaenoi Dam (33%, 18 September)
(Source : National Hydroinformatics Data Center)
The storage level in Pasak Dam has overturned from a decreasing trend to an increasing trend due to the rainfall, however; it is still in a critical level which is insufficient to nourish the agricultural activities. Similarly, the storage level in Kwae Noi Dam is also in an increasing trend.
The Upper Chao Phraya River Flow
The overall water levels in Ping, Wang, Yom and Nan Rivers slightly increase comparing to last month in the Northern Region. The water levels in most stations are in an increasing trend. There are notable critical water levels in Sukhothai Province.
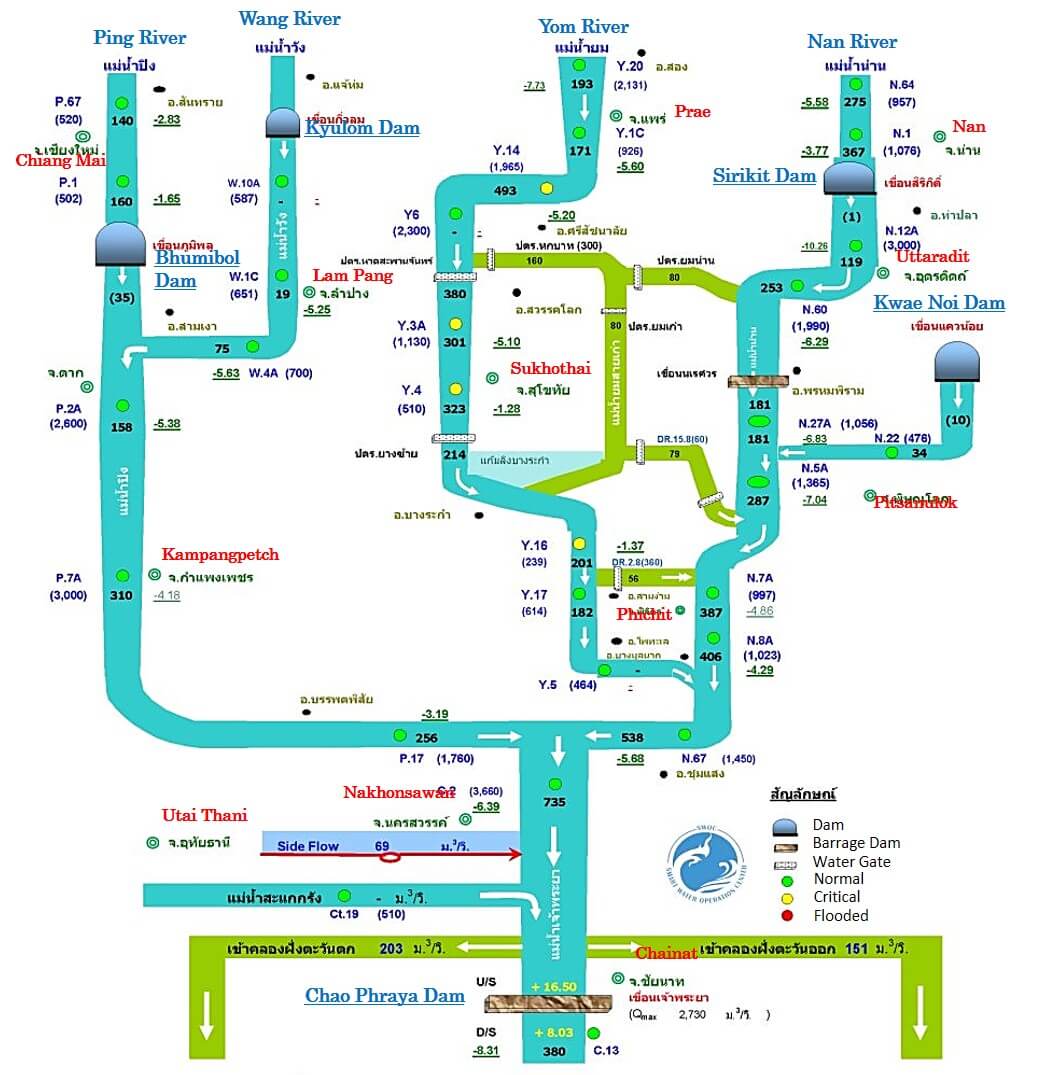
Figure 7: Water Situation in the Chao Phraya River, 18 September 2023
(Source: Smart Water Operation Center : SWOC)
Note: – Numbers in bracket indicate the flow rate of water in m3/sec.
– Numbers with underline indicate higher (+) or lower (-) of water level than the river bank in meters.
– Water levels U/S and D/S are in meters.
The Lower Chao Phraya River Flow
The river levels in lower Chao Phraya are close to the last month. The flow rate of the Chao Phraya River below the Chao Phraya Dam has increased from 55 m3/sec in June to 380 m3/sec which illustrates a high amount of water in The Upper Chao Phraya River. However, there is no critical flood situation.
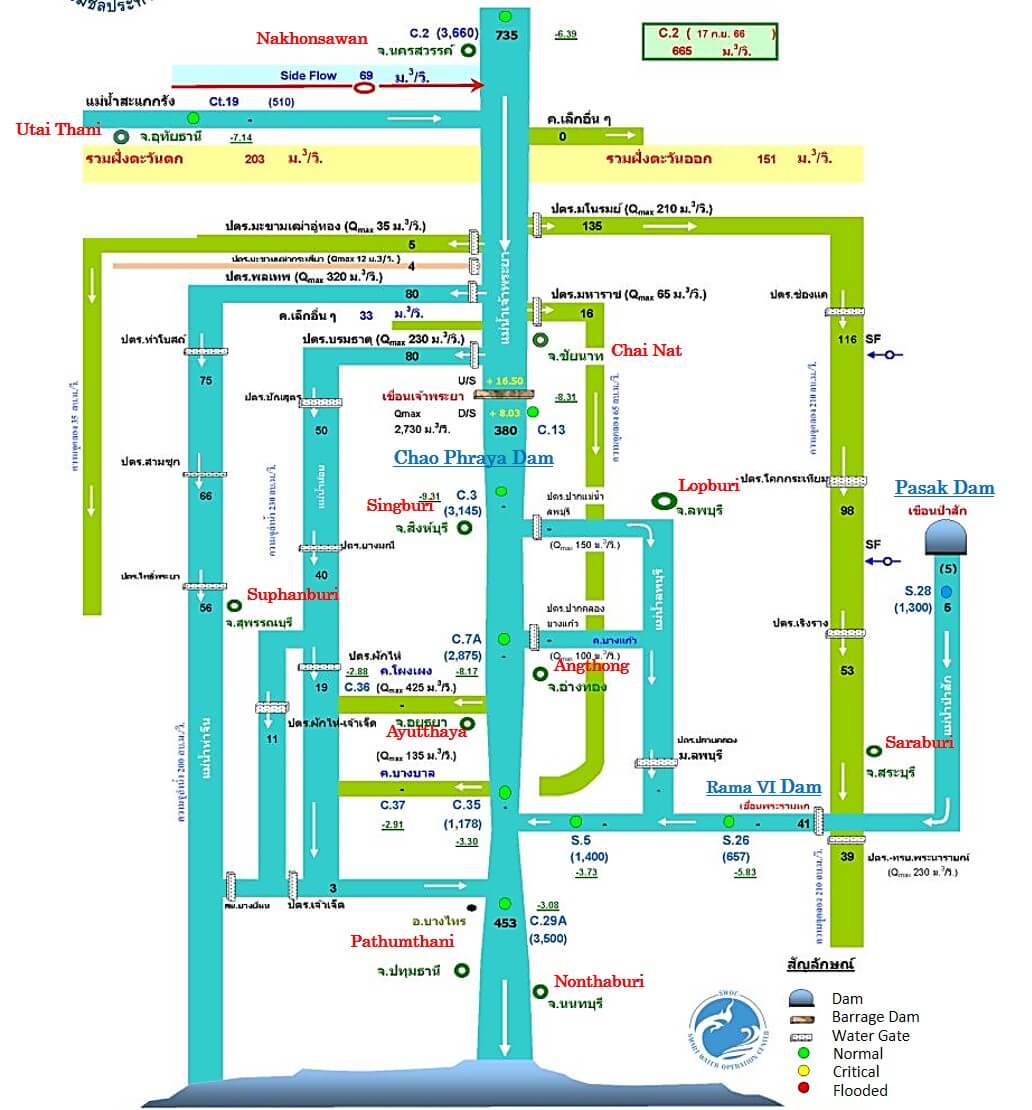
Figure 8: Water Situation in the Chao Phraya River, 18 September 2023
(Source: Smart Water Operation Center : SWOC)
Note: – Numbers in black indicate the flow rate of water in m3/sec.
– Numbers in bracket the flow rate of water in m3/day.
– Numbers with underline indicate higher (+) or lower (-) of water level than the river bank in meters.
References
- http://www.arcims.tmd.go.th/dailydata/yearRain.php
- https://www.tmd.go.th/forecast/monthly
- https://www.bangkokbiznews.com/lifestyle/judprakai/1078941
- https://origin.cpc.ncep.noaa.gov/products/analysis_monitoring/ensostuff/ONI_v5.php
- https://www.posttoday.com/general-news/699024
https://www.bangkokbiznews.com/business/economic/1082186 - http://water.rid.go.th/flood/flood/daily.pdf
https://www.thaiwater.net/water/dam/large - http://water.rid.go.th/flood/plan_new/chaophaya/Chao_up18092023.jpg
- http://water.rid.go.th/flood/plan_new/chaophaya/Chao_low18092023.jpg